From 2015-2020, the University of Tennessee initiated a quality enhancement plan focused on experiential learning. As units and departments across the university worked to enhance the learning environment for our students through experiential learning, our team worked with many dedicated colleagues to capture data related to these experiences. As a result of this collaboration and data collection, we have been able to create two dashboards that showcase the implementation and participation rates of students in 12 types of experiential learning recognized by our campus, both curricular and co-curricular. TLI continues to work with these units to collect this data so that we can highlight the excellent work still being accomplished across our campus related to experiential learning.
All UTK faculty and staff members now have access to view and manipulate the dashboards created from the data that we collected. The first dashboard features the data collected from the 9 colleges at our university that primarily serve undergraduate students, and the second dashboard features data from our administrative partner units. If you would like to view each dashboard you will need to log in using your university provided NetID and password.
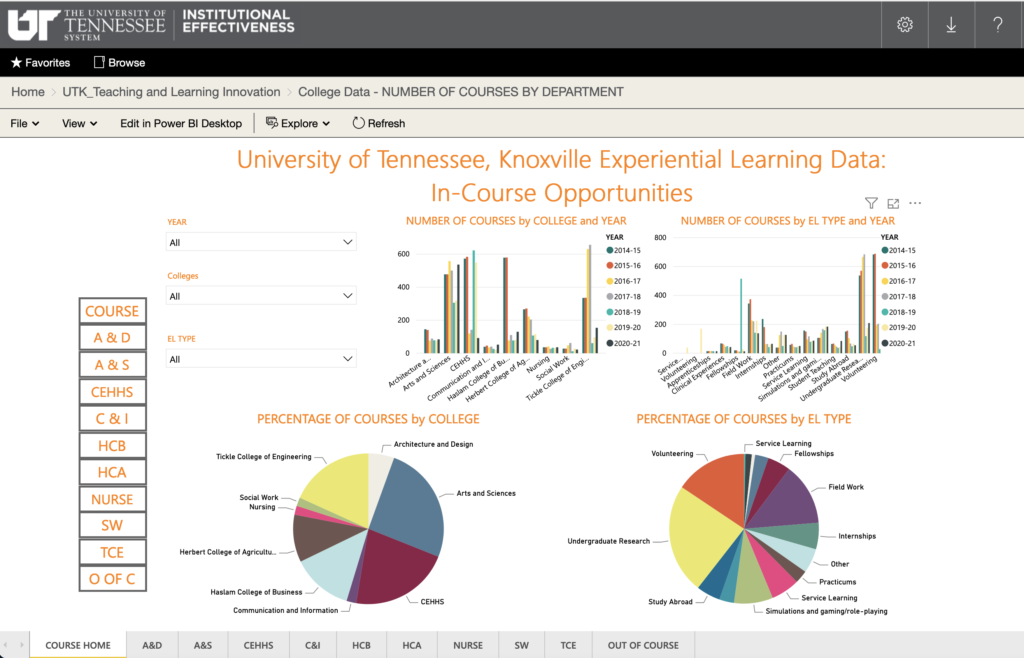
The College-Level Experiential Learning Data dashboard provides data on both curricular and co-curricular experiential learning opportunities offered by individual colleges. For our QEP, we ultimately focused on undergraduate learning. Therefore, we only collected data from the 9 colleges on our campus that offer undergraduate degrees.
Instructions:
- The Home tab provides information of experiential learning courses across all colleges on the UTK campus.
- Each college also has its own tab which highlights EL courses from the 2014-15 academic year to 2021-22 academic year.
- Additionally, information on out-of-course opportunities (i.e., co-curricular) is included for each college (see O of C tab).
- Data can be partitioned by academic year, college, and EL type by clicking on the drop down menu at the top of the page and selecting the year, college, and/or EL type of interest, respectively.
- Data on each college can be partitioned by academic year, department, and EL type by clicking on the drop down menu at the top of the page and selecting the year, department, and/or EL type of interest, respectively.
The Administrative Unit dashboard highlights information collected from various academic support and student life offices on the UTK campus who promote High Impact Practices (HIP). The data are intended to reference and monitor key measures of the HIPs on campus, as reported by the supporting office.
Instructions:
- Each office has its own dashboard page which highlights the important HIP figures from 2014-15 academic year to the 2019-20 academic year.
- Viewers can toggle between pages by clicking the applicable button on the left side of the page.
- Each dashboard can be partitioned by relevant HIP variables specific to the administrative office by clicking the drop down bar and selecting the variable of interest.
- If interested in examining data for a particular semester or year, you can select the specific time frame within each table, chart, or graph. Information for that time frame will be highlighted or adjusted to only show that time frame.